VARIABLE STRESSES IN MACHINE PARTS
COMPLETELY REVERSED OR CYCLIC STRESSES
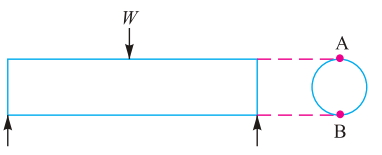
Consider a rotating beam of circular cross section and carrying a load W. This load induces a stress in the beam which is cyclic in nature. A little consideration will show that the upper half of the beam will experience compressive stress and the lower half tensile stress. For each revolution of the beam the stresses are reversed from compressive to tensile. The stresses which vary from one value of compression to one value of tensile are called Completely reversed or Cyclic stress
FATIGUE
In materials science, fatigue is the progressive and localized structural damage that occurs when a material is subjected to cyclic loading. The nominal maximum stress values are less than the ultimate tensile stress limit, and may be below the yield stress limit of the material.
Fatigue occurs when a material is subjected to repeated loading and unloading. If the loads are above a certain threshold, microscopic cracks will begin to form at the surface. Eventually a crack will reach a critical size, and the structure will suddenly fracture. The shape of the structure will significantly affect the fatigue life; square holes or sharp corners will lead to elevated local stresses where fatigue cracks can initiate. Round holes and smooth transitions or fillets are therefore important to increase the fatigue strength of the structure.
Fatigue occurs when a material is subjected to repeated loading and unloading. If the loads are above a certain threshold, microscopic cracks will begin to form at the surface. Eventually a crack will reach a critical size, and the structure will suddenly fracture. The shape of the structure will significantly affect the fatigue life; square holes or sharp corners will lead to elevated local stresses where fatigue cracks can initiate. Round holes and smooth transitions or fillets are therefore important to increase the fatigue strength of the structure.
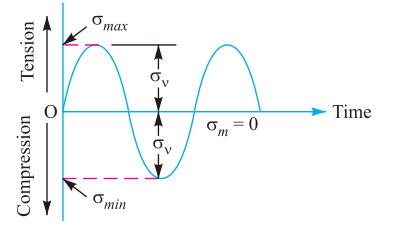
Completely Reversed Stress
FATIGUE LIFE
ASTM defines fatigue life, Nf, as the number of stress cycles of a specified character that a specimen sustains before failure of a specified nature occurs
CHARACTERISTICS OF FATIGUE
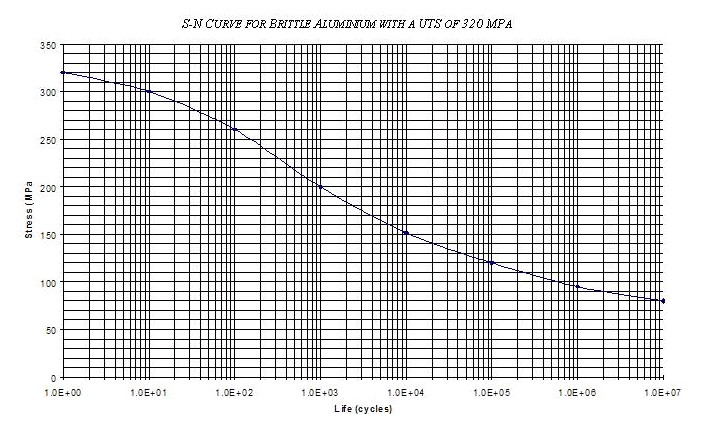
THE S-N CURVE
In high-cycle fatigue situations, materials performance is commonly characterized by an S-N curve, also known as a Wöhler curve . This is a graph of the magnitude of a cyclic stress (S) against the logarithmic scale of cycles to failure (N). S-N curves are derived from tests on samples of the material to be characterized (often called coupons) where a regular sinusoidal stress is applied by a testing machine which also counts the number of cycles to failure. This process is sometimes known as coupon testing. Each coupon test generates a point on the plot though in some cases there is a runout where the time to failure exceeds that available for the test. Analysis of fatigue data requires techniques from statistics, especially survival analysis and linear regression.
ASTM defines fatigue life, Nf, as the number of stress cycles of a specified character that a specimen sustains before failure of a specified nature occurs
CHARACTERISTICS OF FATIGUE
- In metals and alloys, the process starts with dislocation movements, eventually forming persistent slip bands that nucleate short cracks.
- Fatigue is a stochastic process, often showing considerable scatter even in controlled environments.
- The greater the applied stress range, the shorter the life.
- Fatigue life scatter tends to increase for longer fatigue lives.
- Damage is cumulative. Materials do not recover when rested.
- Fatigue life is influenced by a variety of factors, such as temperature, surface finish, microstructure, presence of oxidizing or inert chemicals, residual stresses, contact (fretting), etc.
- Some materials (e.g., some steel and titanium alloys) exhibit a theoretical fatigue limit below which continued loading does not lead to structural failure.
- In recent years, researchers have found that failures occur below the theoretical fatigue limit at very high fatigue lives (109 to 1010 cycles). An ultrasonic resonance technique is used in these experiments with frequencies around 10–20 kHz.
- High cycle fatigue strength (about 103 to 108 cycles) can be described by stress-based parameters. A load-controlled servo-hydraulic test rig is commonly used in these tests, with frequencies of around 20–50 Hz. Other sorts of machines—like resonant magnetic machines—can also be used, achieving frequencies up to 250 Hz.
- Low cycle fatigue (typically less than 103 cycles) is associated with widespread plasticity in metals; thus, a strain-based parameter should be used for fatigue life prediction in metals and alloys. Testing is conducted with constant strain amplitudes typically at 0.01–5 Hz.
THE S-N CURVE
In high-cycle fatigue situations, materials performance is commonly characterized by an S-N curve, also known as a Wöhler curve . This is a graph of the magnitude of a cyclic stress (S) against the logarithmic scale of cycles to failure (N). S-N curves are derived from tests on samples of the material to be characterized (often called coupons) where a regular sinusoidal stress is applied by a testing machine which also counts the number of cycles to failure. This process is sometimes known as coupon testing. Each coupon test generates a point on the plot though in some cases there is a runout where the time to failure exceeds that available for the test. Analysis of fatigue data requires techniques from statistics, especially survival analysis and linear regression.